
Wouter Remmerie
05/08/2021If you’ve been keeping your eye on the Tokyo 2020 Olympics, you would have undoubtedly heard the commentators refer to aerodynamics at some point. Whether it’s cycling, golf or running, when you’re trying to be the best in the world you need to exploit every performance gain you can - and often the biggest gain to be found is in aerodynamics.
Cycling
Cycling has been an Olympic sport since the 1896 Athens games. For Tokyo 2020 there are a total of 22 different cycling events across five disciplines: track cycling, road cycling, mountain bike, BMX Racing and BMX Freestyle. But whatever the category, riders want to extract the maximum performance out of every effort they put in. Over 80% of the energy a cyclist puts into the pedals is used to overcome drag, so improving aerodynamic efficiency is the best way to ride faster for longer.
Shin tape
One of the most controversial talking points from the Tokyo Velodrome has been, quite bizarrely, kinesiology tape. Lining up for their qualifying round in the men’s team pursuit, each of the Danish riders had a strip of kinesiology tape on the front of their shins. Each strip was in exactly the same position and extended upwards from within the socks to just below the knee.
A rider’s shins can be an area of significant aerodynamic gain. Increasing the surface roughness in this location can initiate a turbulent boundary layer which mixes with surrounding air and retains kinetic energy. This energy allows the airflow to remain attached for longer, reducing the wake behind the legs and the associated pressure drag.
In the past, teams have used socks and overshoes to try and exploit this aerodynamic benefit. Overshoes that extend up to the knee can reduce drag by approximately 1%. Although on the 1st of January 2019, the UCI introduced a sock height rule to ensure that socks were only used for clothing and safety and not for gaining an aerodynamic advantage.
It was highly unlikely that each Danish rider was experiencing the same injury on both shins and therefore required kinesiology tape. Of course, this was quickly spotted and protested by other teams and the tape was consequently banned with the Danish team issued a warning.
Helmet design
One of the biggest differences you will spot between indoor and outdoor cycling is the range of helmet designs. Indoor cyclists will often opt for a streamlined tear-drop shaped helmet with an extended tail. By having a seamless transition from the helmet to the back, the airflow can remain attached, avoiding separation and reducing drag. Well-designed tear drop helmets can achieve lower drag coefficients than more conventional spherical shaped helmets, but only if the rider maintains the optimum head position.
However, riding this type of helmet in an outdoor event could have a disastrous effect. Side winds change the angle of attack of the rider and consequently increase their effective frontal area, particularly when riding with covered wheels. This not only increases drag but also introduces side forces which can destabilise the bike. Wearing a long helmet will exacerbate this affect, increasing the frontal area and the resulting lateral forces.
From an aerodynamic point of view, indoor cycling is an aerodynamicists playground as the lack of side wind means that the bike, rider and helmet can all be optimised for only one position. This is why track cyclists will have much more aerodynamic helmets, skinsuits and bikes.
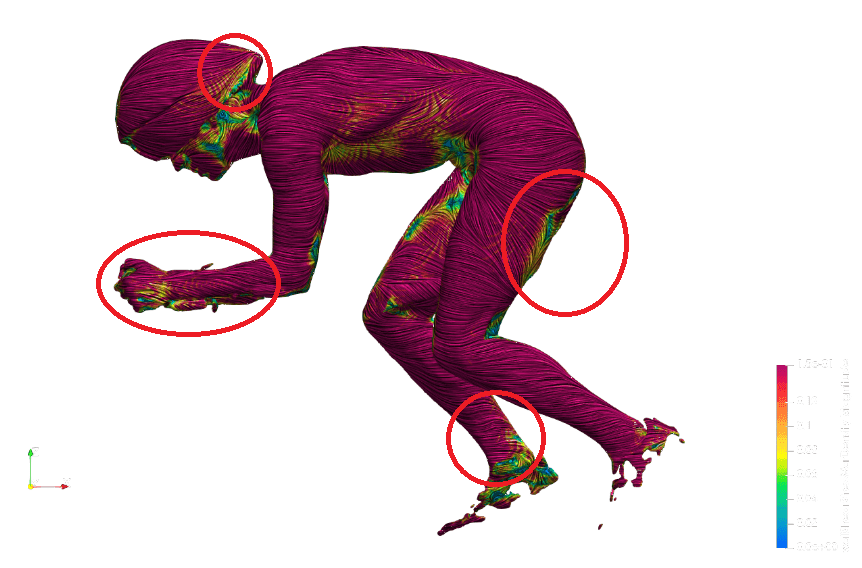
Rider posture
Whether it’s track or road cycling, the rider’s posture has a huge influence on their aerodynamic efficiency. Riders are larger than their bikes and can account for up to 80% of the drag. Moving the torso closer to the bike will reduce frontal area and drag, but if too low, this can affect the rider’s breathing and power output. While the centre of gravity of the rider and the bike should be aligned, with the rider exerting a constant vertical force throughout the four phases of the pedal stroke.
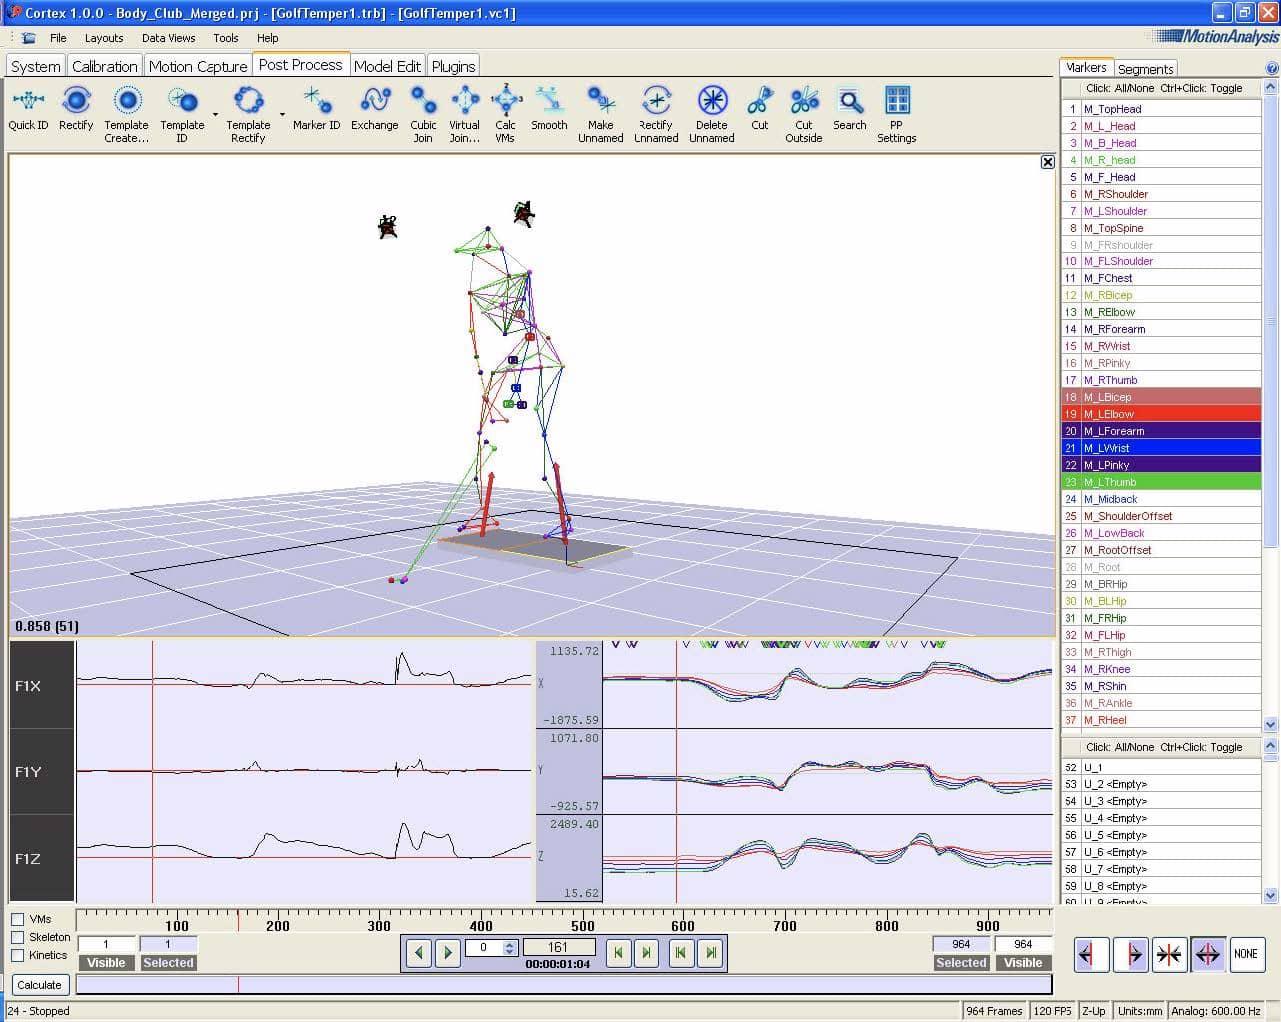
To accurately analyse a rider’s posture and body movements, motion analysis software now plays a key role in helping athletes race faster. Reflective markers are placed on a rider’s articulations and infrared lights along with high speed cameras track the rider’s movements. This can then be used to optimise the rider’s posture, seat height and pedal frequency.
Athletics
Clothing
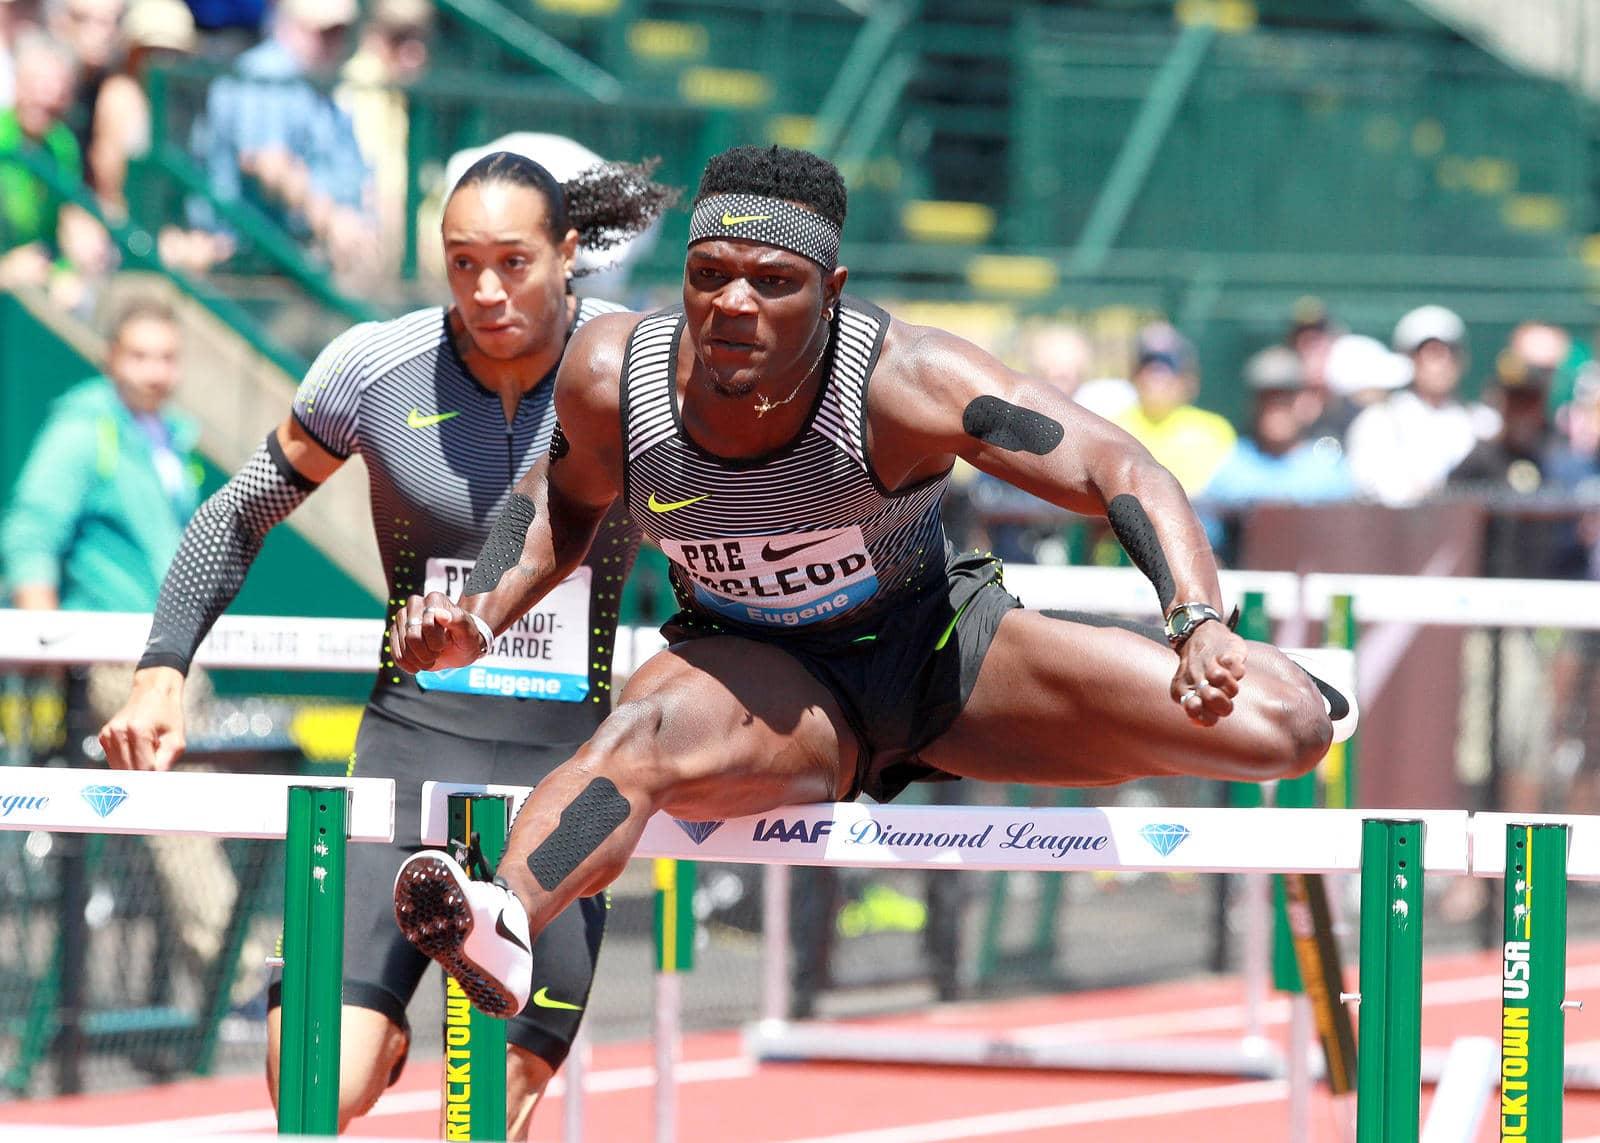
Each Olympic games brings with it new innovations in aerodynamic clothing. The baggy shorts and T-shirts of the past are now replaced with tight fitting synthetic speedsuits that incorporate several different technologies.
One fascinating technology that is now used in kits, therapeutic tapes as well as leg and arm sleeves is the Nike AeroBlades. Exploiting a similar philosophy to golf ball dimples, miniature nodes are located on specific areas of the fabric and channel air around the athlete in the most effective way; reducing drag.
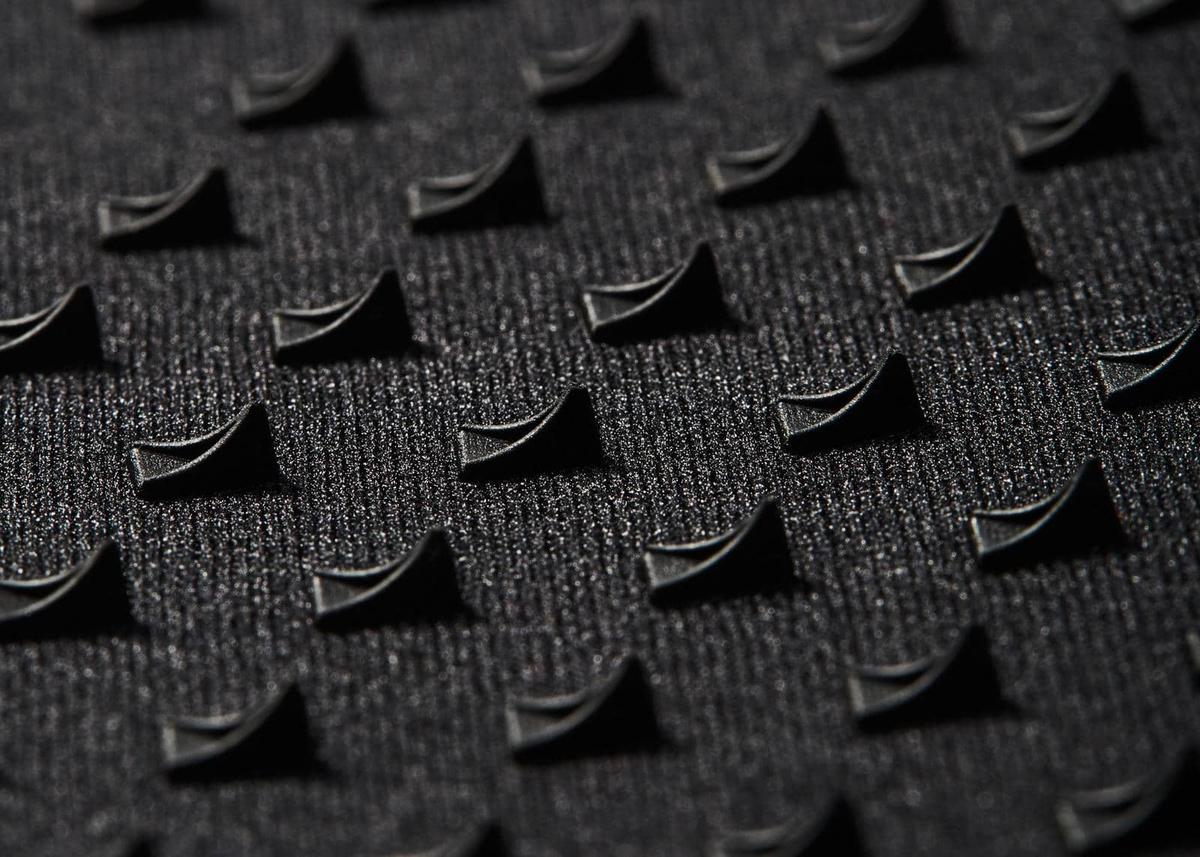
The precise location of these nodes is defined by wind tunnel testing, where mannequins of the same size and shape of Nike’s athletes are used to identify areas of the highest wind resistance. This data then guides the placement of the AeroBlades for that specific athlete to achieve maximum performance. This, along with other technology in Nike’s speedsuits can achieve gains of up to 0.023 seconds over 100m.
The stadium
It’s not just the athletes and equipment that are designed to be aerodynamically efficient, but the stadiums are too. A 2m/s tail wind can drop the 100m sprint time by around a tenth of a second, while a head wind can increase that time by around 0.1s. So within the official limits stated by the World Athletics (+- 2m/s - to be double-checked), times can vary within a range of 0.2 tenths due to aerodynamics alone.
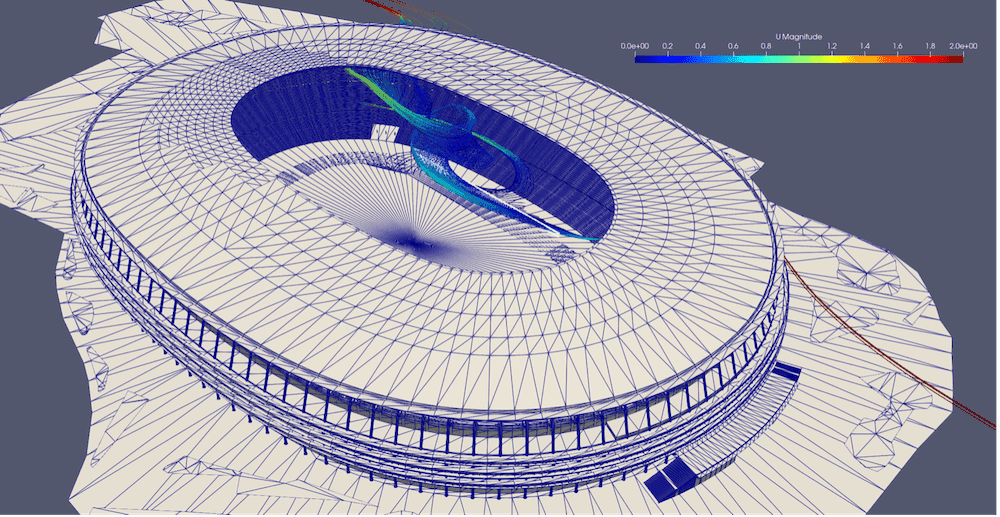
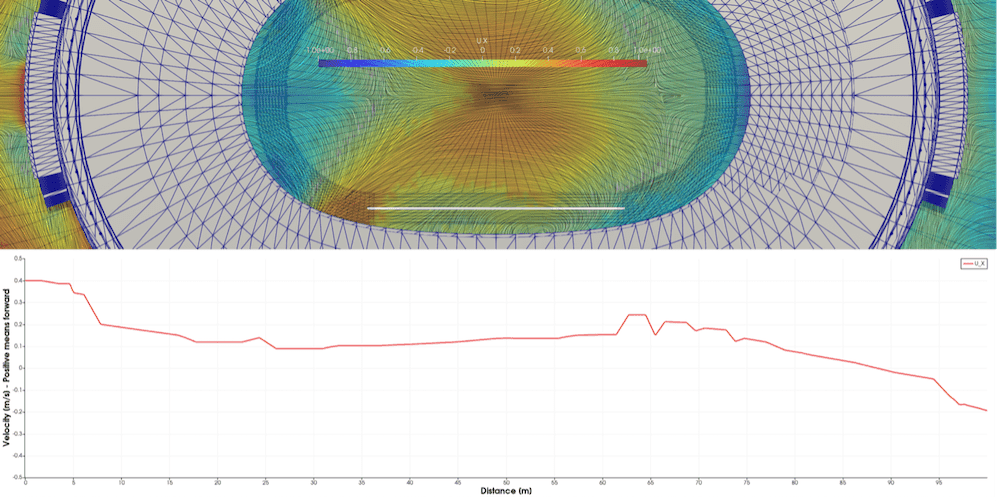
In reality though, the behaviour of the airflow within a stadium is more complex as usually the wind speed along the track is not constant. To investigate this, we used a public 3D model of the Tokyo Olympics stadium and ran CFD simulations to understand how wind outside the stadium translates into complex flow patterns inside the stadium. As you can see from the image below, the result can be a variety of large and small vortices along the race track, illustrated by the white line.
At the midpoint of the track, where the official measurement is taken, we observed a 'virtual wind speed measurement' of around 0.14m/s. At the same time, we saw that at the beginning of the track there was a tail wind of 0.4m/s, which was 280% more than the measured velocity. While near the end, athletes would experience a head wind of 0.1m/s as shown by the graph below. However, as Bert Blocken argues in the link below, there may be some inaccuracies within the measurements of this study.
Why Elaine Thompson-Herah is the fastest woman ever on the planet.
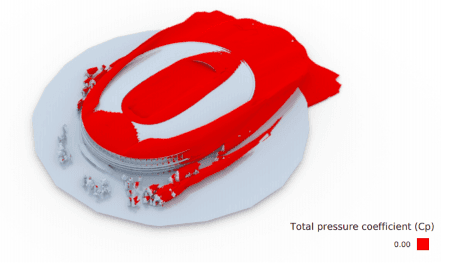
Another aspect is the comfort of the spectators, both inside and outside the stadium. The complex flow structures inside the stadium can make some areas relatively windy, while others can be nicely shielded and more comfortable. Outside the stadium, the building and surroundings can strongly impact flow patterns, making the difference between sitting comfortably on a bench or being blown over when cycling past.
So next time you’re watching the Olympics, see how many aerodynamic innovations you can spot on the athlete's themselves, on their equipment and in their surroundings.
Interesting links:
Cycling: From 3D scan to aerodynamic analysis
Run Your Own Simulation

